

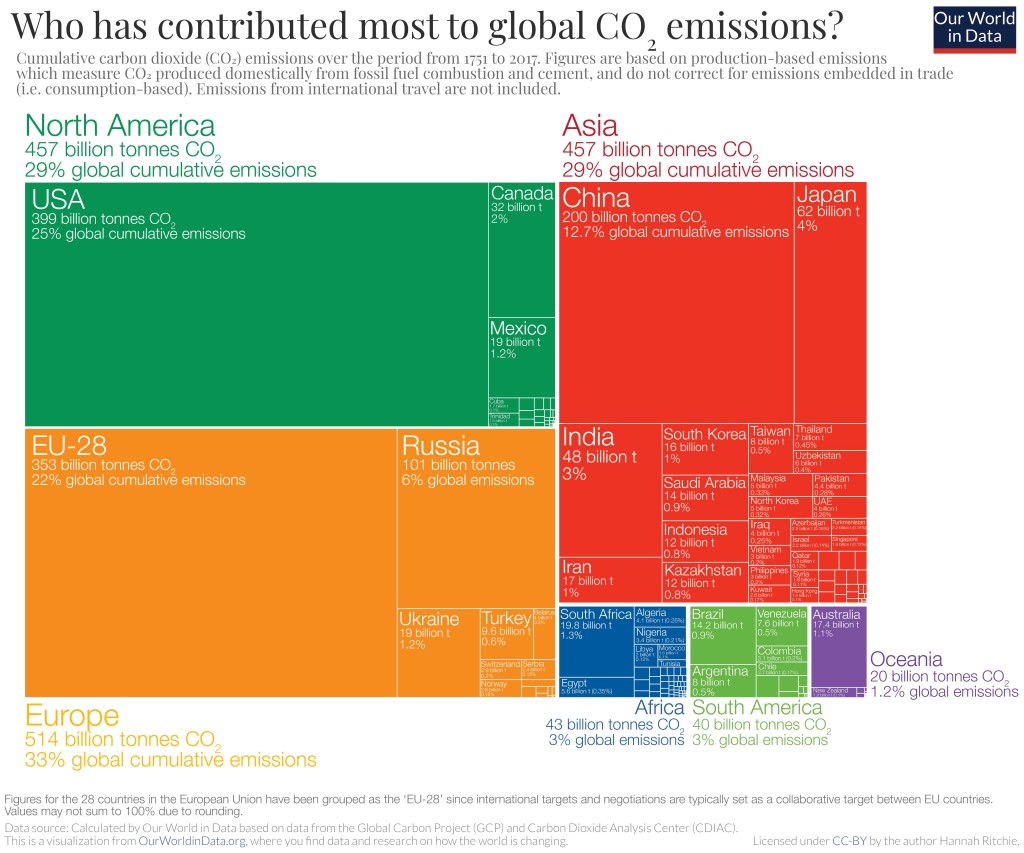
Super fact 43 : The United States has emitted more CO2 than any other country to date, around 400 billion tons since 1751. It is responsible for 25% of historical emissions. Click here.
But what about China? That is 12.7%, or around half. This is surprising information to many Americans, yet it is true, and therefore a super fact. In the US it is very common to blame China for our carbon emissions. In China they blame the US. In Europe they blame the US and China. Who is right? It turns out that the blame game is complicated and futile.
Carbon Emissions Around the World
Who should we blame the most for our carbon emissions?
- The United States is the world’s largest cumulative emitter of carbon emissions.
- On the other hand, China is currently the World’s largest emitter of carbon emissions (34%).
- On the other hand, the US carbon emissions per capita (14.3 ton) is considerably larger than that of China (8.4 ton). China has 1.4 billion people after all and the US only 340 million people.
- On the other hand, China’s carbon emissions have been steadily growing (well flattening lately) whilst those of the United States have been reduced by 29.25% (17.04% trade adjusted) since 1990.
- On the other hand, China used to be very poor and is quickly catching up to our standard of living with the help of fossil fuels, just like the western world once did.
- On the other hand, China, Russia, and India emit several times more carbon emissions per ton of production of several kinds of products that we import (and export). That includes metals, steel, aluminum, transport equipment, electronics, etc. This is referred to as our (US) carbon advantage.
- It should also be noted that the countries that are emitting the most carbon emissions per capita are several smaller developing (third world) countries including Palau, Qatar, Kuwait, Brunei, New Caledonia, Bahrain, United Arab Emirates, Trinidad and Tobago, Gibraltar, Saudi Arabia, Oman, etc.
- On the other hand, according to this analysis presented in the Guardian, the Netherlands has the highest per capita historical emissions, followed by the UK in second place. The analysis calculates the national cumulative emissions from 1850 per person, based on today’s population, among countries with populations of at least 1 million.
- Not to mention that if you consider all of Europe as one unit then Europe is the largest cumulative emitter of carbon emissions (33%), and not the US (25%).
In other words, if you want to blame another country for the carbon emissions, take your pick, well your cherry pick. Why should we do something about our carbon emissions when X is worse? Those who want no action on the global warming / climate change problem love the blame game. Like denial or despair, which are both irrational positions, the blame game hinders action. The blame game can also get very complicated and contentious.
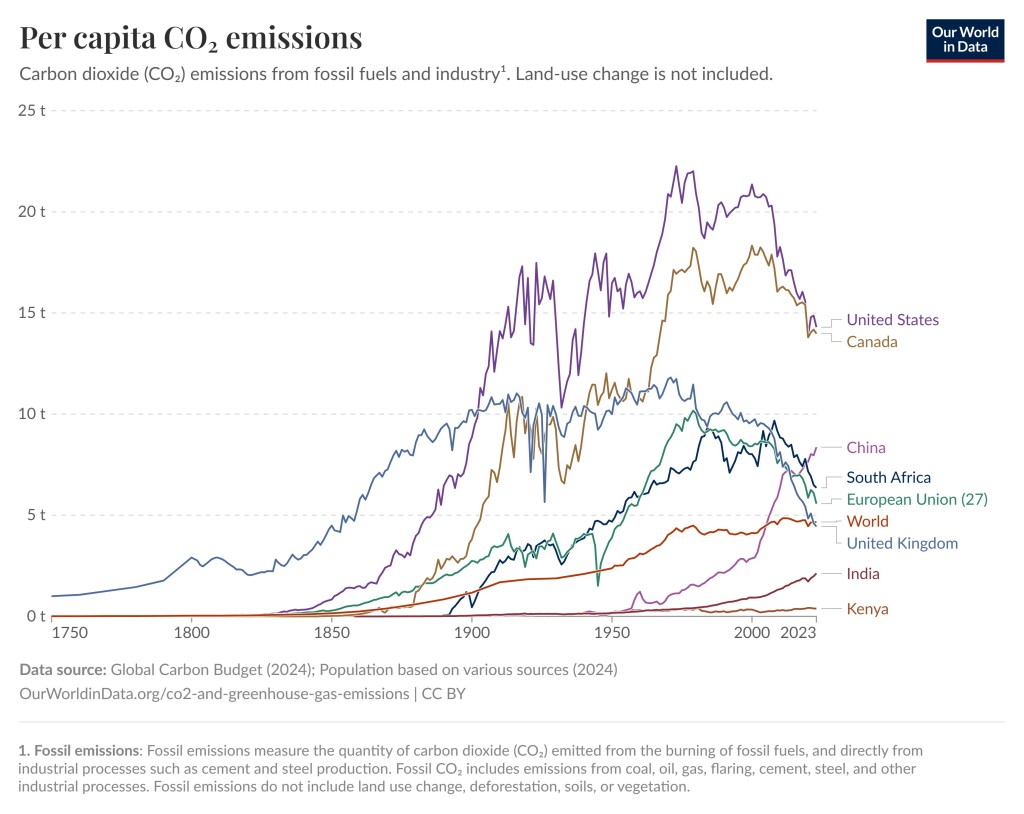
Note regarding the graph above: By clicking here you can find this graph and then select to display any set of countries or regions. Have fun experimenting.
Note regarding Fossil emissions: Fossil emissions measure the quantity of carbon emissions (CO2) emitted from the burning of fossil fuels, and directly from industrial processes such as cement and steel production. Fossil CO2 includes emissions from coal, oil, gas, flaring, cement, steel, and other industrial processes. Fossil emissions do not include land use change, deforestation, soils, or vegetation.
Overview of Cumulative Carbon Emissions
As you can see in the graph below the cumulative carbon emissions from 1751 to 2017 are 25% for the United States, 22% for the EU (28 countries), 12.7% for China, 6% for Russia, 4% for Japan, and 3% for India. If you count the entire continent of Europe, you get 33% for Europe.

Wonderful post 🎸🙏
LikeLiked by 1 person
Thank you Satyam
LikeLike
Really interesting… and worrying!
LikeLiked by 1 person
Thank you Luisa
LikeLiked by 1 person
You’re more than welcome 🌹
LikeLiked by 1 person
Europe is higher than the USA in total but not per capita% Europe has 734 million people compared to the USA with 340 million. An interesting post that is scary given all the weird weather.
LikeLiked by 1 person
Sorry, 744 m people
LikeLiked by 1 person
Yes you are right. Europe has 744 million people and the US 340.
LikeLike
Yes you are right Robbie. People often pick one of these facts to blame someone else, so it is good to be aware of them all.
LikeLike
We are all equally responsible for the problem, I think. None of us wants to make the big sacrifices like not flying abroad. We want to live our modern lifestyles that are power intensive.
LikeLiked by 1 person
Yes you are exactly right Robbie, and it makes it very convenient to blame someone else. However, we could all start with the low hanging fruit, things that will make a big difference without a lot of sacrifice. Often that varies from country to country and from person to person, and the first step is finding out what that is. Here in Texas I think it is stopping our Texas legislators from sabotaging clean energy and not buying/driving big SUVs and big trucks that you have no use for. Farmers need them but not a software engineer.
LikeLike
I want a 4 x 4 for our bush trips. My 2 x 4 isn’t cutting it. I will get a fuel efficient one though. One thing I do is use reusable water bottles. I can’t stand plastic waste. I take our bottles everywhere we go. We also use reusable shopping bags.
LikeLiked by 1 person
I think that is great Robbie
LikeLike
I’ve heard arguments that we in Canada shouldn’t be expected to inconvenience ourselves by reducing emissions because there are only 40 million of us. But our oil and gas sales to other countries are part of worldwide emissions, so that’s a faulty argument. CO2 doesn’t recognize borders.
LikeLiked by 1 person
Yes you are right Audrey and Canada’s carbon emissions per capita is almost as high as that of the US and the per capita metric is probably more relevant when it is about who should do what. Everyone has to do their part.
LikeLiked by 1 person
It’s always better to blame someone else than to do something about it, isn’t it?
I’m surprised to see Canada after U.S. in that chart, but I think the reason is not because Canada has too many CO2 emissions, but because it has a smaller population.
I’m curious what a graph would look like based on how much each individual pays for such emissions.. I was surprised to see recently the Carbon Tax amount was more than 30% of my total gas bill, on top of all other kind of fees. But of course, another important thing is whether something effective is done with these money at the end of the day..
LikeLiked by 1 person
Yes blaming someone else is something we all are very good at. The graph you are referring to is the per capita emissions, basically the amount of emissions for each person in that country. It is probably the most relevant graph in this context. It is great that Canada is trying to do something about it, Sweden is too. I think it would have been best if the proceeds of the 30% you are mentioing had gone back to people in the form of monthly checks and direct deposits. Analysis show that 2/3 of the population, especially lower income, would have recieved more money than the extra they paid, while retaining the incentives. I am sure those 30% are being put to good use but you don’t see it.
LikeLike
Mutual cooperation would work better than blaming. After all, we are one world, yes? I’m not surprised to see Canada up there too, but I believe we are making concerted efforts. Thank goodness the Conservative party did not win the election, since many of them are anti-environmentalists.
LikeLiked by 1 person
Yes you are right, we are in this together all of us and I know that Canada is making a concerted effort, for which I am very grateful.
LikeLike
Excellent research and post, Thomas. A lot of what goes on nowadays is irrational (i.e., destroy electric cars but scream green energy). Anymore, I just try to live as kindly towards the planet and others as I can. 🌞
LikeLiked by 1 person
Thank you so much Gwen and you are right, so much is irrational, including destroying EVs. It is great to hear that you are living kindly towards the planet.
LikeLiked by 1 person