

Super fact 42 : The developed nations (rich countries) have reduced their carbon emissions since the 1990’s despite continued GDP growth, even if we take offshore production into account. In addition, many developing countries have succeeded in reducing their emissions as well. Other fast-growing developing countries have flattened or at least slowed their increase in carbon emissions. Many countries have decoupled economic growth from CO2 emissions. In other words, we do not need to increase carbon emissions or burn more fossil fuels to grow the economy.
This is good news as well as a surprise to many people who falsely believe that to grow the economy (grow GDP) you need to burn more fossil fuels and an increase in carbon emissions is inevitable if you want to grow the economy. The data shows otherwise. This is important news that is difficult to believe in for many people. It is a super fact.
Carbon Emissions and GDP
In the past carbon emissions were strongly correlated with national wealth. The wealthier a nation was the higher its carbon emissions were and as the economy grew so did the carbon emissions. This has not been true since the 1990’s. The developed nations of the world have continued growing their GDP whilst reducing their carbon emissions.
You may think that the reason is that we shipped much of our manufacturing overseas and that if you consider the consumers in the importing country responsible for the overseas emissions this decoupling of GDP and emissions would disappear. But you would be wrong. Even if you make the consumers in the importing country responsible for the emissions during production in the exporting country the emissions have gone down. One example taken from this article in Our World in Data is the United Kingdom.
In the graph below for the UK the GDP (adjusted for inflation) grew by 53.26% between 1990 and 2023 and the emissions were reduced by 57.66%. If make UK consumers 100% responsible for the emissions in China and India, etc., caused by the production of goods imported to the UK the reduction until 2022 was 38.59%. That is not as much but it is still impressive and demonstrates the decoupling between GDP growth and carbon emissions.
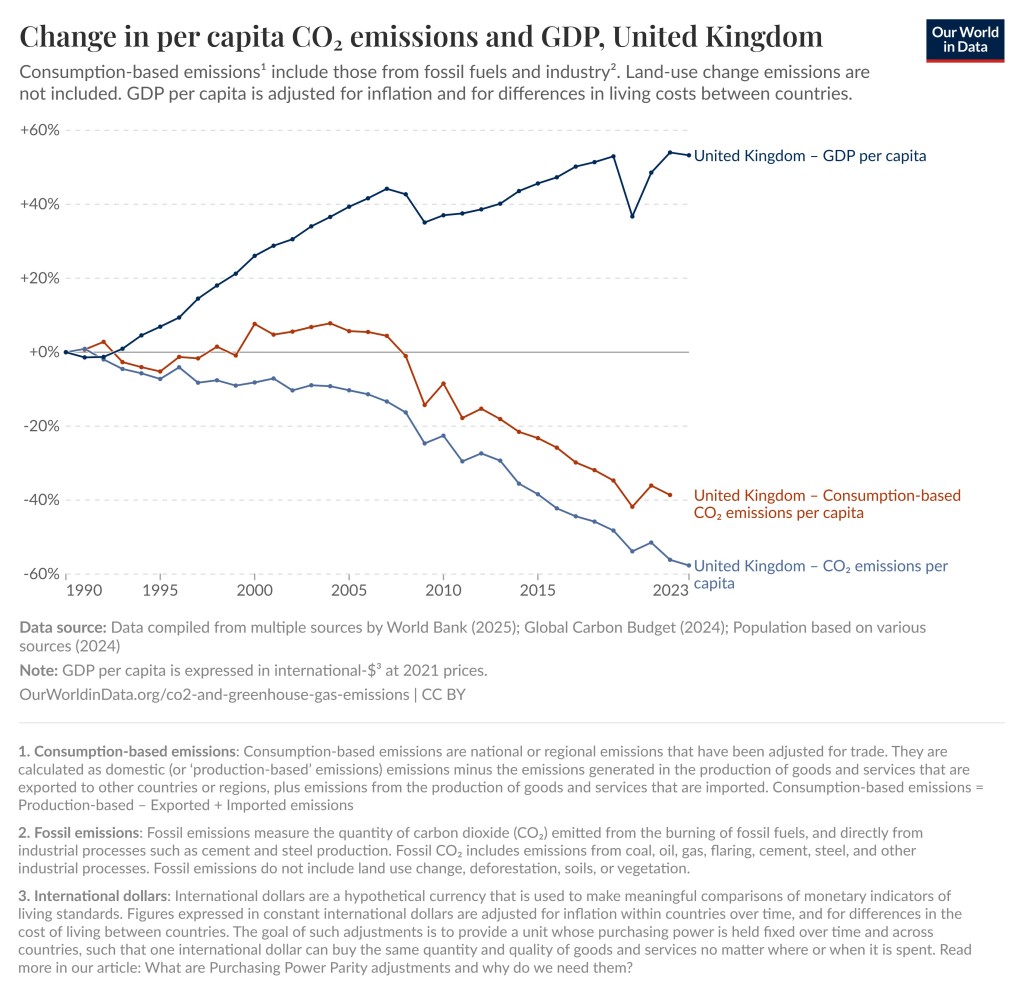
The text in the graph above is difficult to read so I’ve copied it below in larger text:
- Consumption-based emissions: Consumption-based emissions are national or regional emissions that have been adjusted for trade. They are calculated as domestic (or ‘production-based’ emissions) emissions minus the emissions generated in the production of goods and services that are exported to other countries or regions, plus emissions from the production of goods and services that are imported. Consumption-based emissions = Production-based – Exported + Imported emissions.
- Fossil emissions: Fossil emissions measure the quantity of carbon dioxide (CO2) emitted from the burning of fossil fuels, and directly from industrial processes such as cement and steel production. Fossil CO2 includes emissions from coal, oil, gas, flaring, cement, steel, and other industrial processes. Fossil emissions do not include land use change, deforestation, soils, or vegetation.
- International dollars: International dollars are a hypothetical currency that is used to make meaningful comparisons of monetary indicators of living standards. Figures expressed in constant international dollars are adjusted for inflation within countries over time, and for differences in the cost of living between countries. The goal of such adjustments is to provide a unit whose purchasing power is held fixed over time and across countries, such that one international dollar can buy the same quantity and quality of goods and service no matter where or when it is spent. Read more in our article: What are Purchasing Power Parity adjustments and why do we need them?
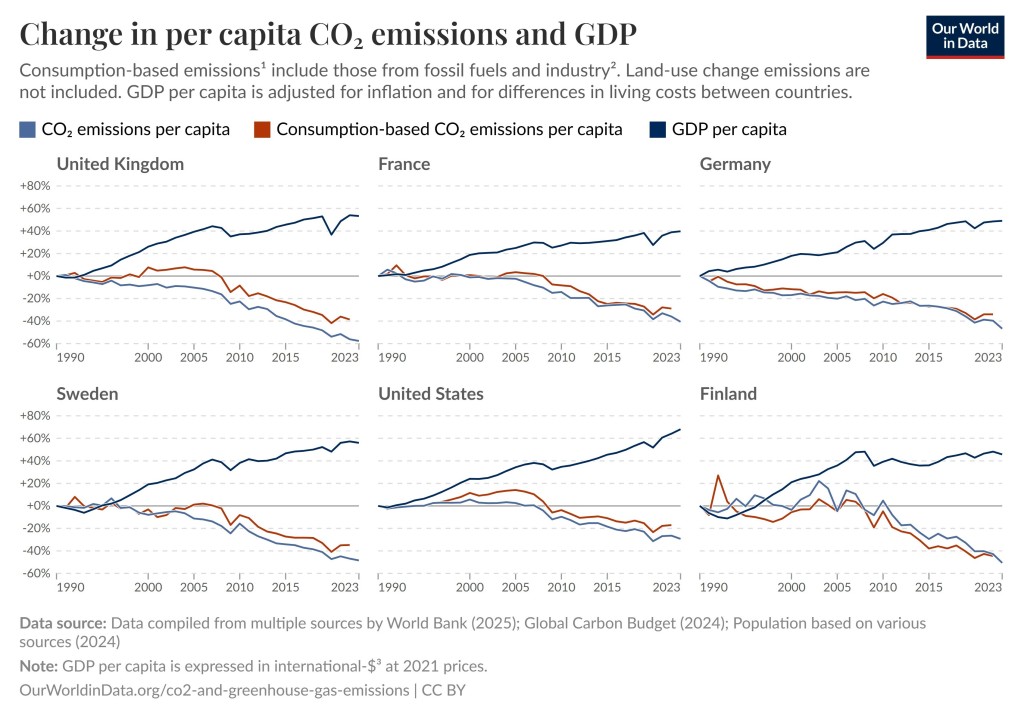
Below is the same type of graphs for the United Kingdom as well as France, Germany, Sweden, United States and Finland. The numbers for these countries are as follows:
- United Kingdom: GDP growth 53.26%, CO2 emissions reduction 57.66%, trade adjusted CO2 emissions reduction 38.59%.
- France: GDP growth 39.74%, CO2 emissions reduction 40.64%, trade adjusted CO2 emissions reduction 28.82%.
- Germany: GDP growth 49.04%, CO2 emissions reduction 46.72%, trade adjusted CO2 emissions reduction 33.95%.
- Sweden: GDP growth 56.00%, CO2 emissions reduction 48.45%, trade adjusted CO2 emissions reduction 34.75%.
- United States: GDP growth 68.05%, CO2 emissions reduction 29.25%, trade adjusted CO2 emissions reduction 17.04%.
- Finland: GDP growth 45.69%, CO2 emissions reduction 50.54%, trade adjusted CO2 emissions reduction 42.79%.
Note these are emissions reduction numbers per capita (growth for GDP) not carbon emissions per capita. For example, the United States has three to four times larger carbon emissions per capita as, for example, Sweden or France.
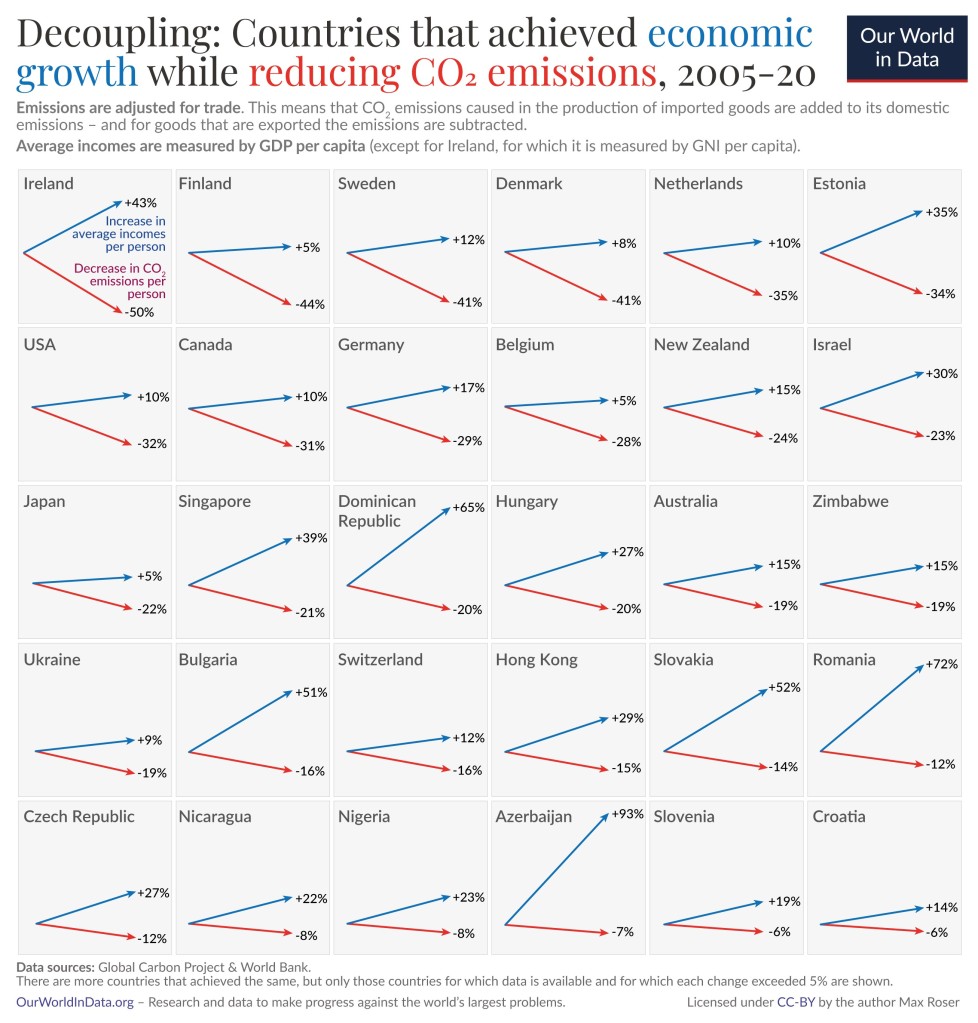
Many Countries Have Reduced Their Carbon Emissions
However, the story does not end with these six countries or even with the developed world. The 30 graphs below all demonstrate significant reductions in carbon emissions as GDP is growing, demonstrating a decoupling between GDP growth and carbon emissions. Note that Azerbaijan’s GDP grew by 93% as its carbon emissions was reduced by 7% (all carbon emissions below are adjusted for trade).
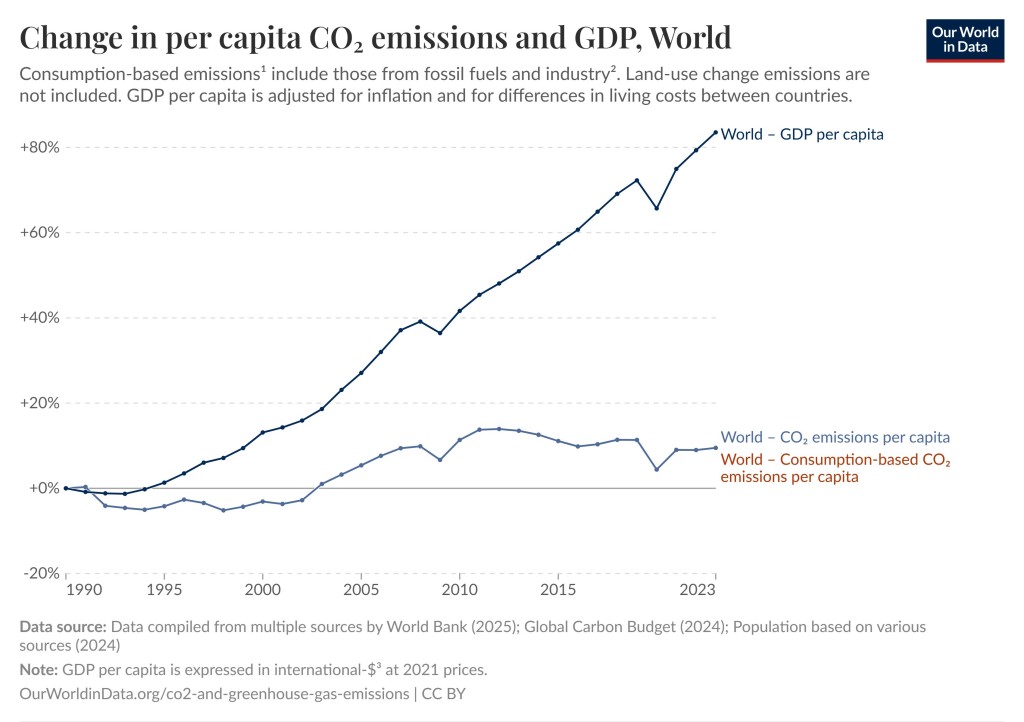
The World’s Carbon Emissions Per Capita Has Flattened
World GDP per capita has increased by 83.54% since 1990 while carbon emissions per capita have grown by 9.48%. That may not be as impressive but note two things. That is still a decoupling between economic growth and if you look in the graph, you’ll see that carbon emissions were higher in 2008 to 2019. The curve has flattened and gone down a bit. Global Warming caused by our burning of fossil fuels may be the greatest environmental challenge in recorded history, but we are slowly and steadily turning things around. We are not doing it fast enough to avoid major damage to our eco systems and perhaps civilization, but we are still turning things around. If you have any doubts about global warming / climate change or that we are causing it click here for a summary of the evidence.
China’s Carbon Emissions
One reason the world’s carbon emissions per capita have not been reduced much despite the fact that so many countries have reduced their emissions is that the world’s largest emitter China, has grown their carbon emissions steadily since 1990. Between 1990 and 2023 China’s GDP per capita (and adjusted for inflation) grew by 1,245.28% and their emissions grew by 288.43% per capita. Remember that China has 1.4 billion people so that is a big carbon blast for the world.
However, before you blame China too much remember that China’s carbon emissions per capita is less than that of the United States and that of many other developed countries, and the country with the largest cumulative carbon emissions is the United States. China’s economic growth has been immense, and its immense population of 1.4 billion people explains its huge impact on the world’s carbon emissions.
Fortunately, it now appears that China’s emissions have finally peaked.

Good job, Thomas! You should send this one to the Financial Times or The Economist. More people should know about this – I think part of our problem right now is despair and it’s good to see that things are turning around. Best, Ben Bennett Voylesbennettvoyles.de Tel. +49 151 62967276 Winterfeldtstr. 39 10781 Berlin, Germany
LikeLiked by 2 people
You are right Ben, both denial of the problem and despair hinder action. Global warming is a huge problem and it is a huge challenge, but we are making progress event though it is slow and not enough. But the potential for progress is enormous. So much has happened that is paving the way for solutions. Hannah Ritchie, a research director at Our World In Data (the high quality data research organization I am quoting a lot in this post), wrote a book about this called “Not the End of the World”. We’ve solved some huge environmental problems in the past and even though Global Warming / Climate Change might be our biggest challenge, a lot of progress has been made and it is slowly starting to show up in the statistics. I hope Financial Times and the Economist have heard of this book. Thank you so much for your very kind words Ben. It is always good to hear from you.
LikeLiked by 1 person
Hi Thomas, this is an interesting post. It’s a pity the USA doesn’t set a better example. A lot of Chinese products are exported to the USA so pressure could be applied.
LikeLiked by 2 people
Of course, if I’m wrong in my thinking you are welcome to correct me.
LikeLiked by 1 person
Yes you are right, but even if you make US consumers responsible for all the emissions on imported goods from China and elsewhere, the US emissions has still gone down. The US blames China for the problem, China blames the US, and Europe blames the US and China. But the blame game is always played from your own perspective. China is currently the world’s largest total greenhouse gas emitter and has not reduced their emissions unlike the US and Europe. On the other hand US emissions are still larger per capita than China’s and the US is by far the largest cumulative emitter (over time) in the world. Europe is doing better than both but if you go back in time Europe was a pretty bad cumulative emitter too (especially the UK).
One place where you apply pressure on China (and Russia) is imports from China of certain carbon intensive products such as steel, aluminum, and fossil fuels. The US produce those products significantly more cleanly and using a carbon border adjustment mechanism (CBAM) like Europe is starting to do, might be a good idea. It is not a tariff, not in a regular sense, just an adjustment to level the playing field when one country produce dirtier goods more cheaply by wrecking the environment.
LikeLiked by 1 person
Yes, this comment makes perfect sense, Thomas. I understand completely and It’s what I intrinsically understand.
LikeLiked by 2 people
Thank you Robbie
LikeLiked by 1 person
🧡
LikeLiked by 1 person
Thank you
LikeLiked by 1 person
Great article. I didn’t look at all of the countries but I assume most developing countries (India, Indonesia etc) are similar to China. Coal is often blamed for their pollution, and lack of policy I guess too. Maggie
LikeLiked by 2 people
Yes, it is not true across the board, but many developing countries are growing their economies fast, like China, and in doing so they use increasing amounts of dirty fossil fuels. However, they are increasingly transitioning to cleaner energy and their increase in greenhouse gas emissions is flattening, like the case of China.
LikeLike
Really interesting post. I’m glad that countries are making an effort to reduce their emissions. It’s sad that it doesn’t make too much of a difference overall but I truly hope we keep moving forward and not backwards.
LikeLiked by 3 people
Thank you Pooja. It could have been much worse. We could have been on a trajectory of steadily increasing emissions for the world. If economic growth had not been decoupled from fossil fuels and carbon emissions, then the trajectory would have straight up and emissions would have been several times worse. However, the fact that most developed countries have succeeded in reducing their emissions and developing countries with fast growing economies have succeeded in reigning in the emissions has prevented a sharp increase, and instead flattened the emissions curve. Hopefully, we can do even better though.
LikeLiked by 2 people
I’m really glad to hear that, hopefully at some point instead of flattening the emissions curve we can see a clear decrease.
LikeLiked by 1 person
Yes it looks like we are moving in that direction. Hopefully we will continue to improve.
LikeLiked by 1 person
Good to know that progress has been made worldwide, but too bad it’s not enough. This surprised me:
“China’s carbon emissions per capita is less than that of the United States and that of many other developed countries”
Like many others, I assumed China was the worst offender.
LikeLiked by 1 person
Yes China is the country that emits the most, but not per capita. That’s because they are 1.4 billion people. For example, the US emits about half of what China does, but the US has only 330 million people, so per capita the US emit more. I can add that per capita the US is not the worst offender either, that’s some small countries. Then you have to consider the cumulative emissions (historical) as well. It gets complicated. That’s why you shouldn’t play the blame game, but we do. The US blames China, China blames the US, and the EU blames China and the US. The blame game prevents action.
LikeLiked by 1 person
The world should unite to solve these problems, but that’s highly unlikely, unfortunately.
LikeLiked by 1 person
You are right Debbie. Everyone has to do their part. When everyone blames everyone else that is difficult.
LikeLike