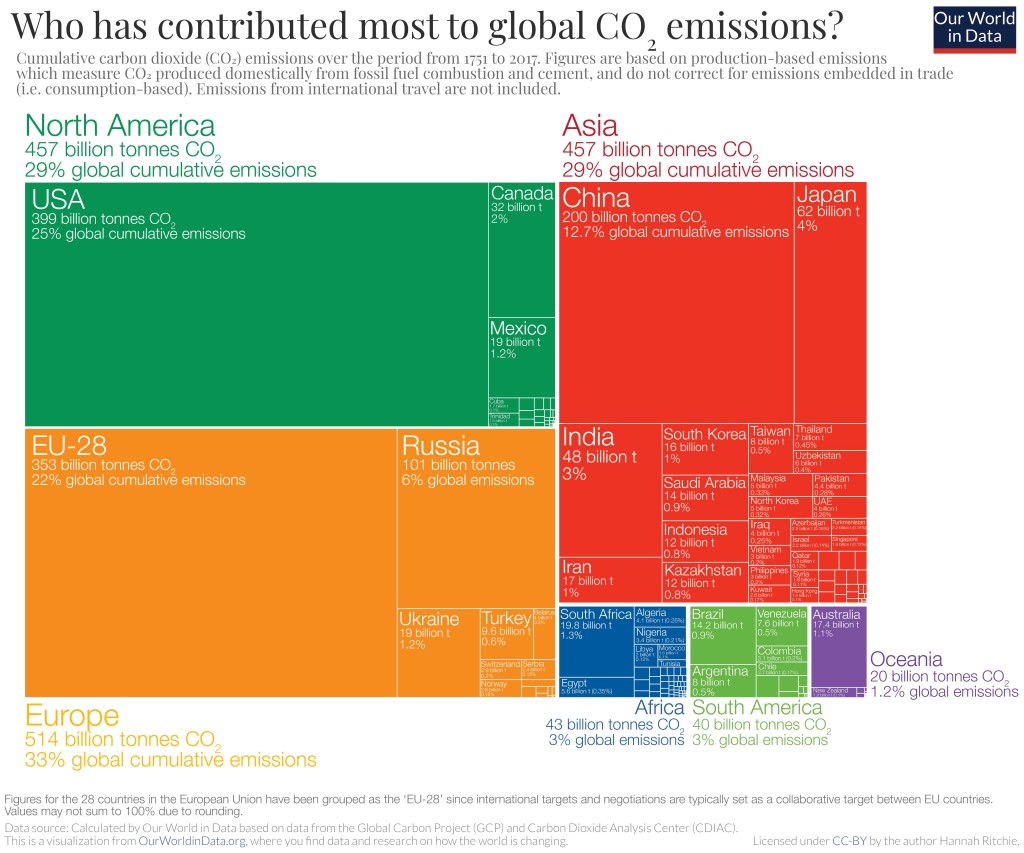

Super fact 43 : The United States has emitted more CO2 than any other country to date, around 400 billion tons since 1751. It is responsible for 25% of historical emissions. Click here.
But what about China? That is 12.7%, or around half. This is surprising information to many Americans, yet it is true, and therefore a super fact. In the US it is very common to blame China for our carbon emissions. In China they blame the US. In Europe they blame the US and China. Who is right? It turns out that the blame game is complicated and futile.
Carbon Emissions Around the World
Who should we blame the most for our carbon emissions?
- The United States is the world’s largest cumulative emitter of carbon emissions.
- On the other hand, China is currently the World’s largest emitter of carbon emissions (34%).
- On the other hand, the US carbon emissions per capita (14.3 ton) is considerably larger than that of China (8.4 ton). China has 1.4 billion people after all and the US only 340 million people.
- On the other hand, China’s carbon emissions have been steadily growing (well flattening lately) whilst those of the United States have been reduced by 29.25% (17.04% trade adjusted) since 1990.
- On the other hand, China used to be very poor and is quickly catching up to our standard of living with the help of fossil fuels, just like the western world once did.
- On the other hand, China, Russia, and India emit several times more carbon emissions per ton of production of several kinds of products that we import (and export). That includes metals, steel, aluminum, transport equipment, electronics, etc. This is referred to as our (US) carbon advantage.
- It should also be noted that the countries that are emitting the most carbon emissions per capita are several smaller developing (third world) countries including Palau, Qatar, Kuwait, Brunei, New Caledonia, Bahrain, United Arab Emirates, Trinidad and Tobago, Gibraltar, Saudi Arabia, Oman, etc.
- On the other hand, according to this analysis presented in the Guardian, the Netherlands has the highest per capita historical emissions, followed by the UK in second place. The analysis calculates the national cumulative emissions from 1850 per person, based on today’s population, among countries with populations of at least 1 million.
- Not to mention that if you consider all of Europe as one unit then Europe is the largest cumulative emitter of carbon emissions (33%), and not the US (25%).
In other words, if you want to blame another country for the carbon emissions, take your pick, well your cherry pick. Why should we do something about our carbon emissions when X is worse? Those who want no action on the global warming / climate change problem love the blame game. Like denial or despair, which are both irrational positions, the blame game hinders action. The blame game can also get very complicated and contentious.
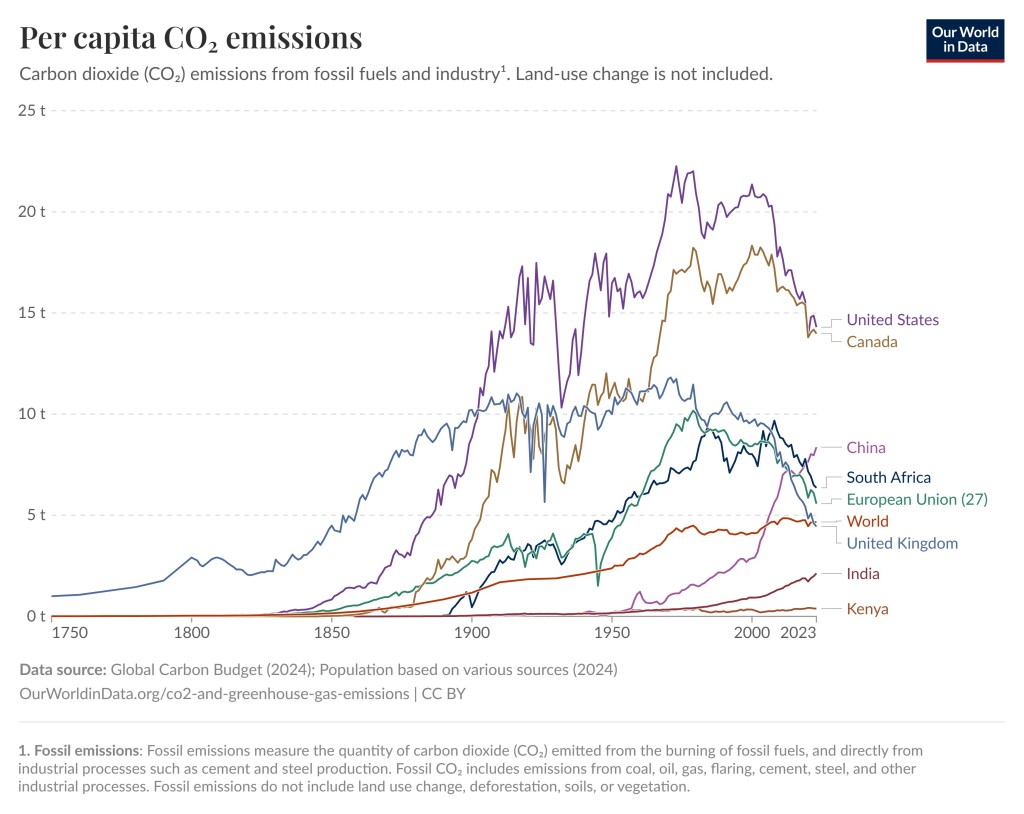
Note regarding the graph above: By clicking here you can find this graph and then select to display any set of countries or regions. Have fun experimenting.
Note regarding Fossil emissions: Fossil emissions measure the quantity of carbon emissions (CO2) emitted from the burning of fossil fuels, and directly from industrial processes such as cement and steel production. Fossil CO2 includes emissions from coal, oil, gas, flaring, cement, steel, and other industrial processes. Fossil emissions do not include land use change, deforestation, soils, or vegetation.
Overview of Cumulative Carbon Emissions
As you can see in the graph below the cumulative carbon emissions from 1751 to 2017 are 25% for the United States, 22% for the EU (28 countries), 12.7% for China, 6% for Russia, 4% for Japan, and 3% for India. If you count the entire continent of Europe, you get 33% for Europe.